InTDS ArchivebyFrancisco Castillo CarrascoVisualizing Your EmbeddingsAn evolutionary guide from SNE to t-SNE and UMAPJul 15, 20222Jul 15, 20222
Praveen Gnanaselvam5 Ways to Make “Good” Visualization “Great”Data visualization is a graphic representation of data that helps people understand the meaning behind numbers and statistics. Data…Jun 2, 20226Jun 2, 20226
InTDS ArchivebyPranay DaveTop 5 techniques for Explainable AINot 1, not 2, but 5 techniques for Explainable AINov 27, 20213Nov 27, 20213
InTDS ArchivebyPaul HiemstraAltair plot deconstruction: visualizing the correlation structure of weather dataUsing interactive Altair plots, Python and Pandas to more efficiently explore the correlation structure of a weather datasetFeb 29, 20202Feb 29, 20202
InTDS ArchivebyMaarten BreddelsMultivolume rendering in Jupyter with ipyvolume: cross-language 3d visualizationThe Jupyter notebook is becoming the standard environment for data science in many fields, with it comes the requirements of visualization…Sep 14, 20183Sep 14, 20183
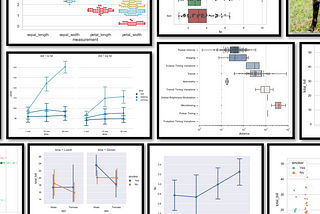
InTDS ArchivebyDipanjan (DJ) SarkarA Comprehensive Guide to the Grammar of Graphics for Effective Visualization of Multi-dimensional…Learn effective strategies for leveraging a layered Grammar of Graphics framework for effective data visualizationSep 12, 20186Sep 12, 20186
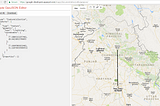
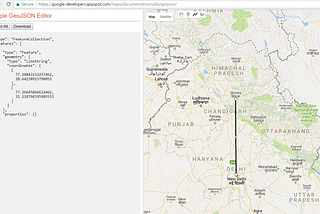
Sumit Kumar AroraA primer on GeoJSON standard and visualization toolsDevelop better insights on GeoJSON standard and visualization.Feb 3, 20186Feb 3, 20186
InNightingalebyAndy KirkWhat Makes a Data Visualisation Elegant?The Data Visualization Society members share their views on this most elusive of design concepts.Sep 12, 20192Sep 12, 20192
InTDS ArchivebyPayman Taei5 Data Storytelling Tips for Creating More Persuasive Charts and GraphsWorking with numbers isn’t usually thought of as a sexy job. After all, occupations like accounting and data entry aren’t exactly the most…Aug 28, 20185Aug 28, 20185
InTDS ArchivebyRuta GokhaleA designer’s guide to visualize a text datasetCreate a data-driven visualization with Python and RSep 13, 20192Sep 13, 20192
InTDS ArchivebyRaimi KarimAnimated RNN, LSTM and GRURecurrent neural network cells in GIFsDec 14, 20188Dec 14, 20188
InTDS ArchivebyGergely D. NémethVisualisation of embedding relations (Word2Vec, BERT)In this story, we will visualise the word embedding vectors to understand the relations between words described by the embeddings. This…Oct 15, 20192Oct 15, 20192
InTDS ArchivebySviatoslav KovalevLarge Graph Visualization Tools and ApproachesWhat to do, if you need to visualize a large network graph but all tools you try can only draw a hairball or eat all your RAM and hang…Nov 15, 20196Nov 15, 20196
InTDS ArchivebyAndre Ye5 Lesser-Known Seaborn Plots Most People Don’t KnowBut really should knowJul 21, 20202Jul 21, 20202